
FAND vs CWoN — comparative analysis
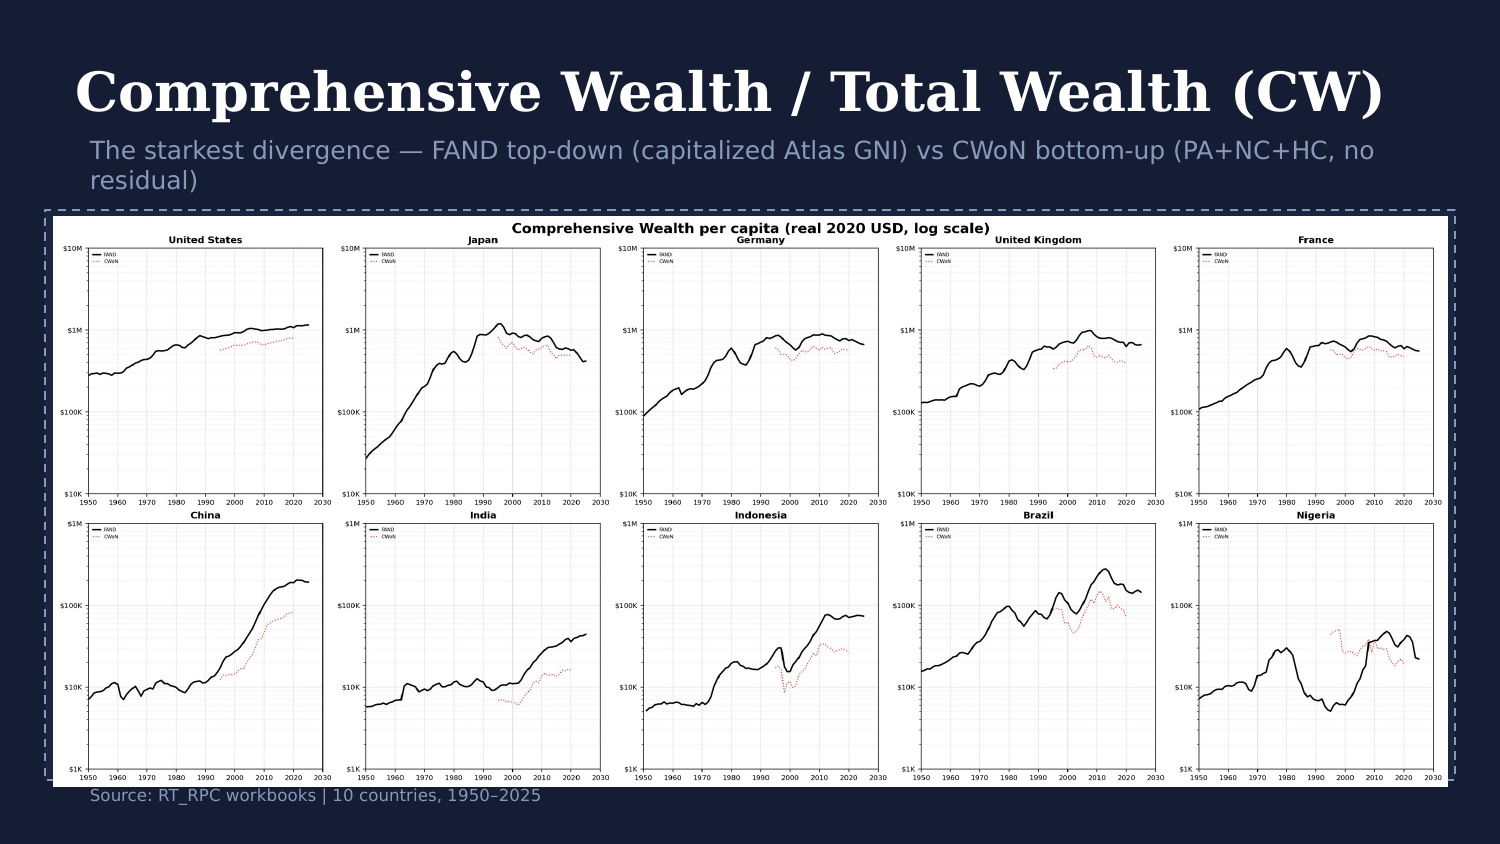
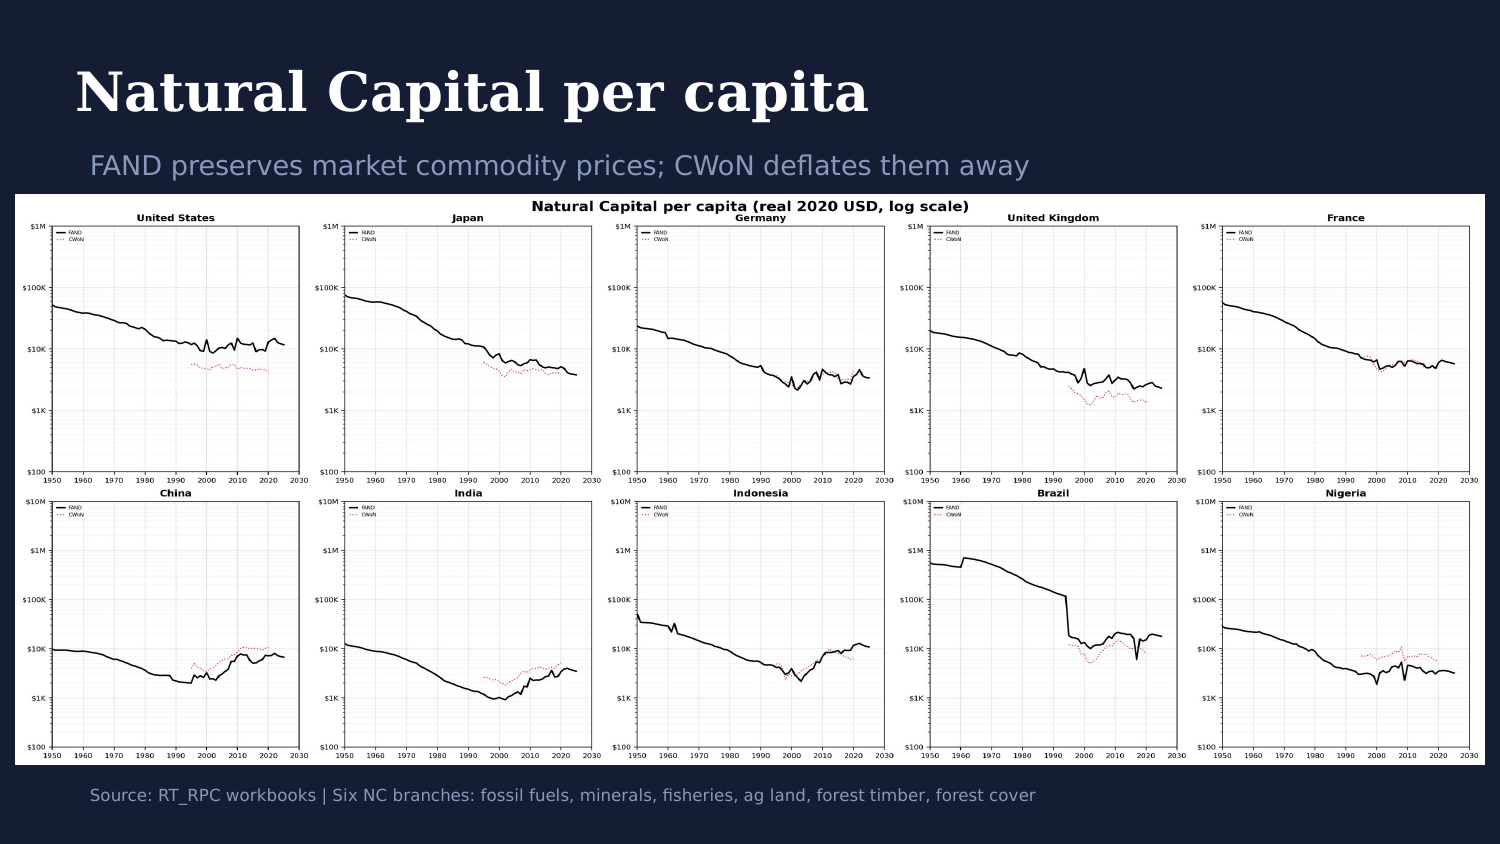
How FAND's national balance sheets diverge from World Bank Changing Wealth of Nations.
The narrated Appendix E walkthrough video is still in production (source deck not yet rendered through HeyGen). The comparative charts below are ready.
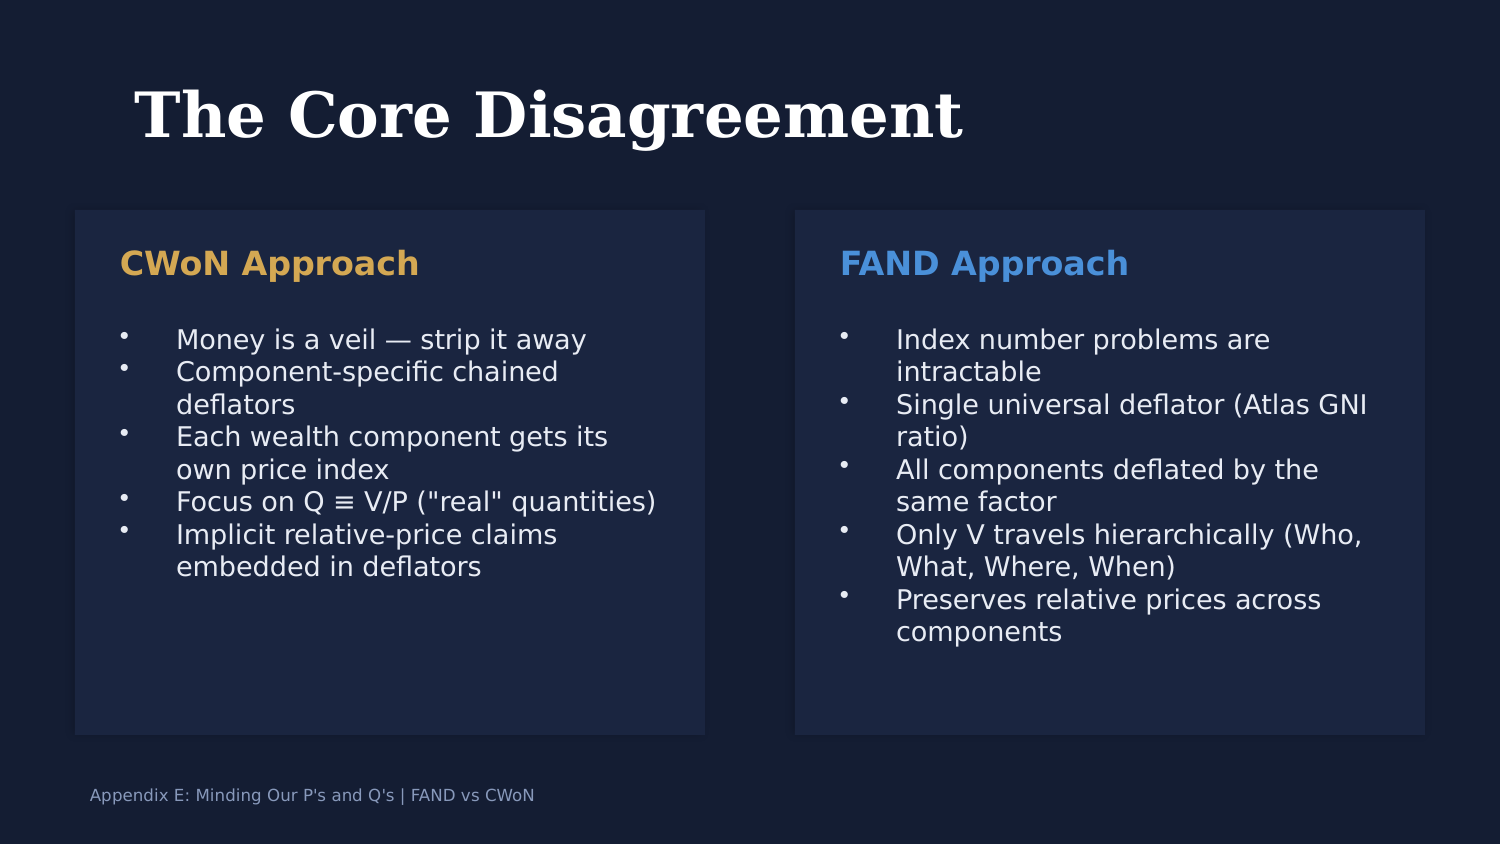
John pioneered the Changing Wealth of Nations (CWoN) at the World Bank as part of MEP 1995. FAND is the continuation — what MEP 1995 would look like if you could rebuild it with modern data, modern compute, and the lessons of three decades watching what worked and what didn’t.
Where the two methods disagree
Comprehensive Wealth, ten countries, 1950–2025
Natural Capital, ten countries
What’s different — the short version
- FAND’s balance-sheet identity is closed.
CW = PA + NC + RW; RW = HR + SI, verified to $0.000000. The identity holds at every scale. - FAND measures substantive rights (HR + SR) explicitly. CWoN treats human capital as residual; FAND derives it from a clean OLS production function (
ln(RW_pc) = α + β₁·MYS + β₂·min(LE,65) + β₃·t, with N=10,031 country-years, R²=0.497). - Cross-border is per-side, not net. CBA (gross foreign assets) and CBL (gross foreign liabilities) are independent stocks. No NIIP netting — the gross flows reveal exposure that nets to nothing.
- The IS-Branch Principle. Institutional infrastructure that conventional methodologies assume but don’t measure (rule of law, trust in courts, institutional capacity). FAND measures it inside SR.
Related reading
- The balance sheet equation — the FAND identity these charts are computed from.
- How we grade what we publish — the badge system behind this page’s Experimental rating.
- Global Leaves crosstab — the subnational density × wealth finding this comparison sits alongside.
What’s here at launch
- The Appendix E narrated video (pending — source deck not yet rendered through HeyGen)
- The comparative analysis charts (FAND vs CWoN for selected countries)
- Pointer to the full Appendix E working paper in /deep-dive/