
Global Leaves crosstab
7,101 of 7,360 administrative units across 237 countries, in one crosstab.
Global Leaves walkthrough video
A ten-minute narrated walkthrough of the density × wealth crosstab across 7,101 administrative units.
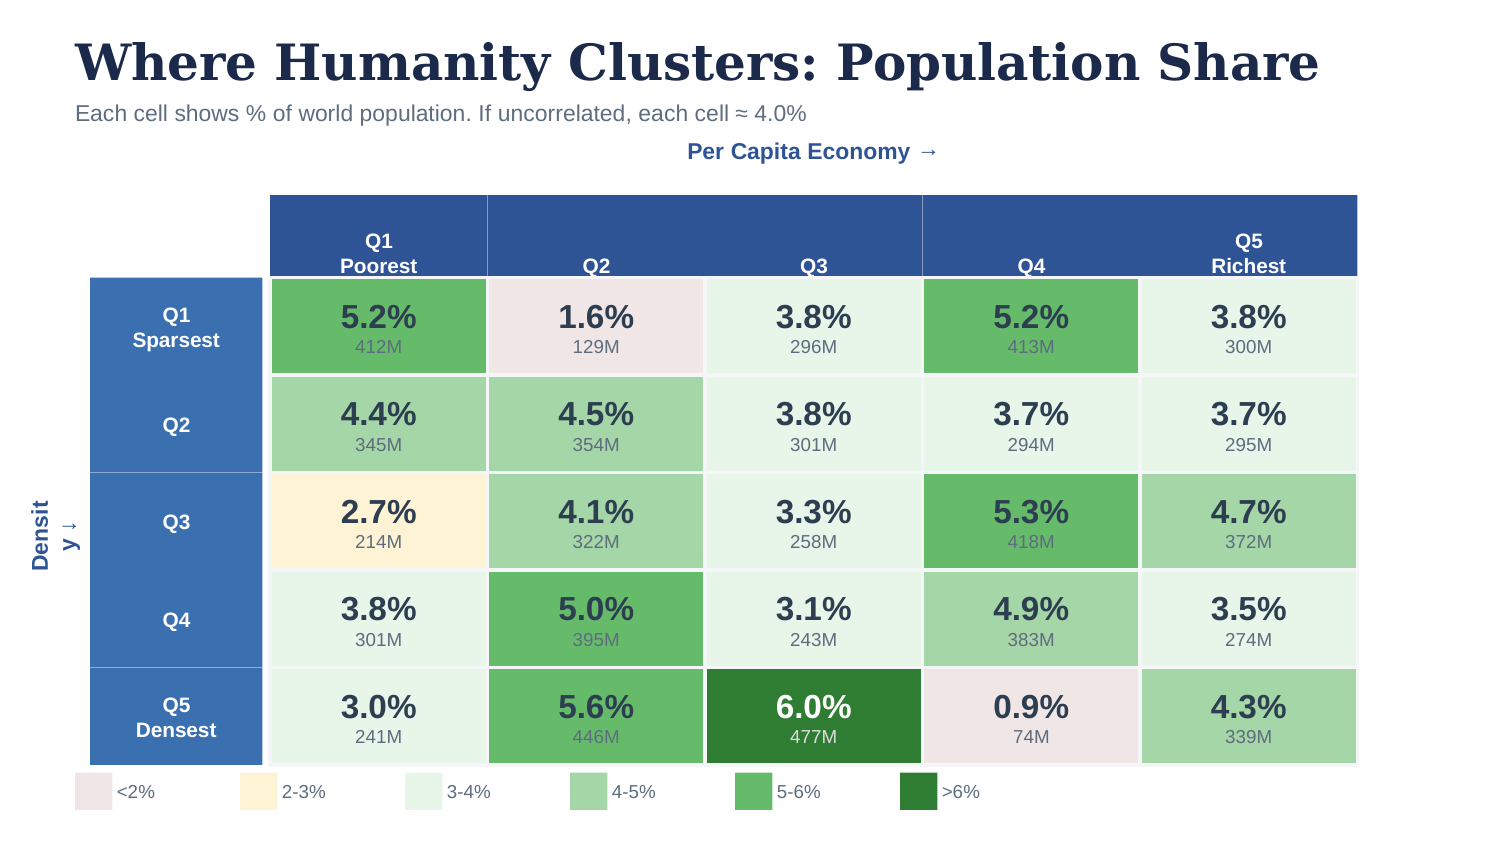
The flagship result. Every administrative unit that carries both a population density and a per-capita income — 7,101 of the 7,360 FAND tracks, across 237 countries — placed in a 5×5 grid by the structure of its wealth.
What the crosstab shows
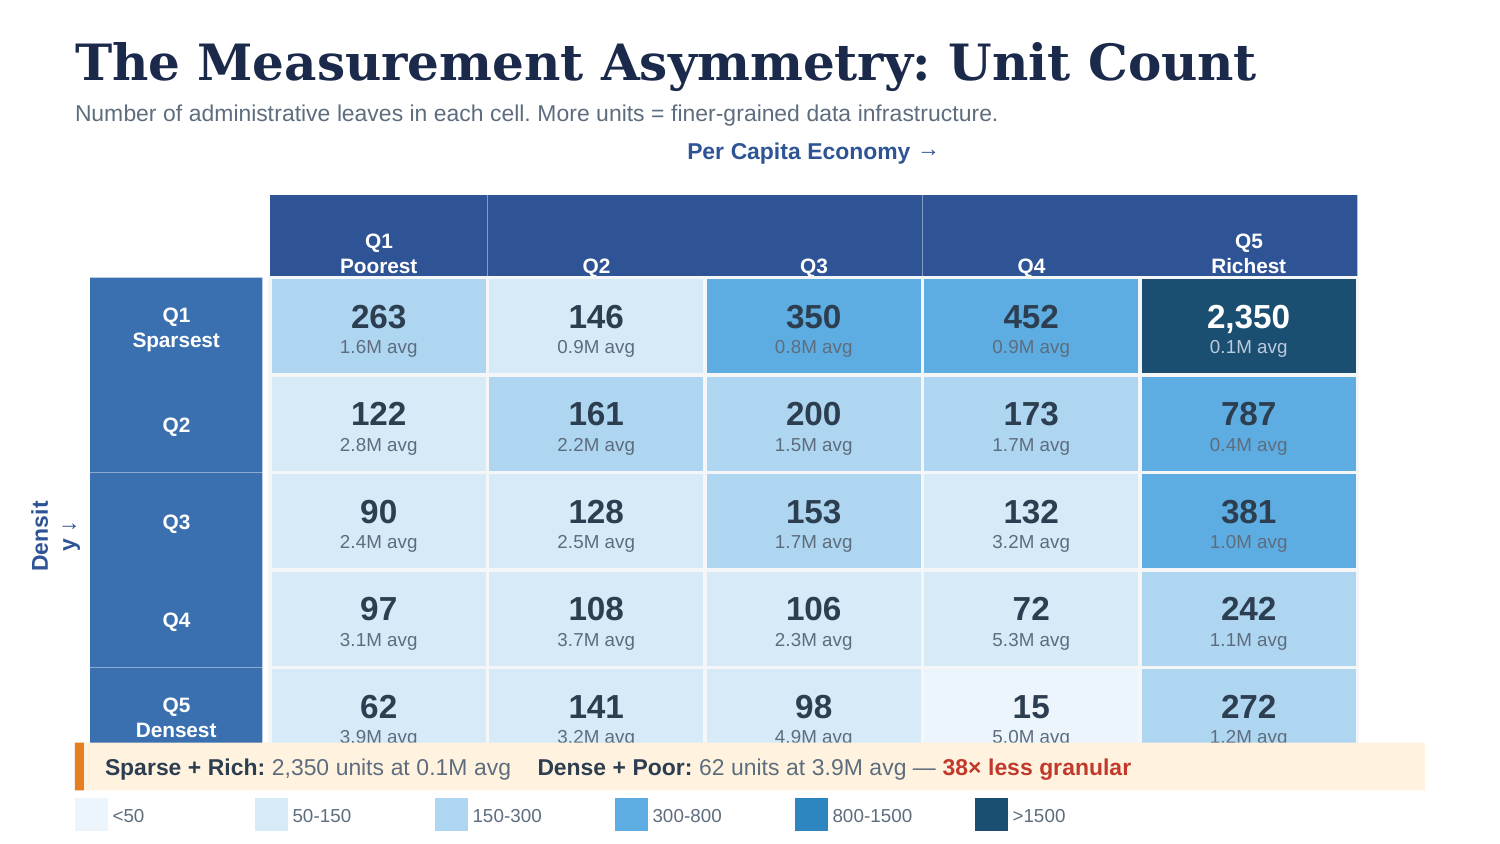
The world’s wealth distribution measured by what kind of capital dominates each place. The headline finding: a 38× measurement asymmetry between how finely rich, sparse places are measured and how finely poor, dense places are measured — 2,350 administrative units cover the Sparse+Rich cell, averaging 127,000 people each, while just 62 units cover Dense+Poor, averaging 3.9 million people each. Same balance-sheet identity, same population weighting; the measurement infrastructure itself is unevenly distributed, and it’s uneven in the direction that most needs granular governance data.
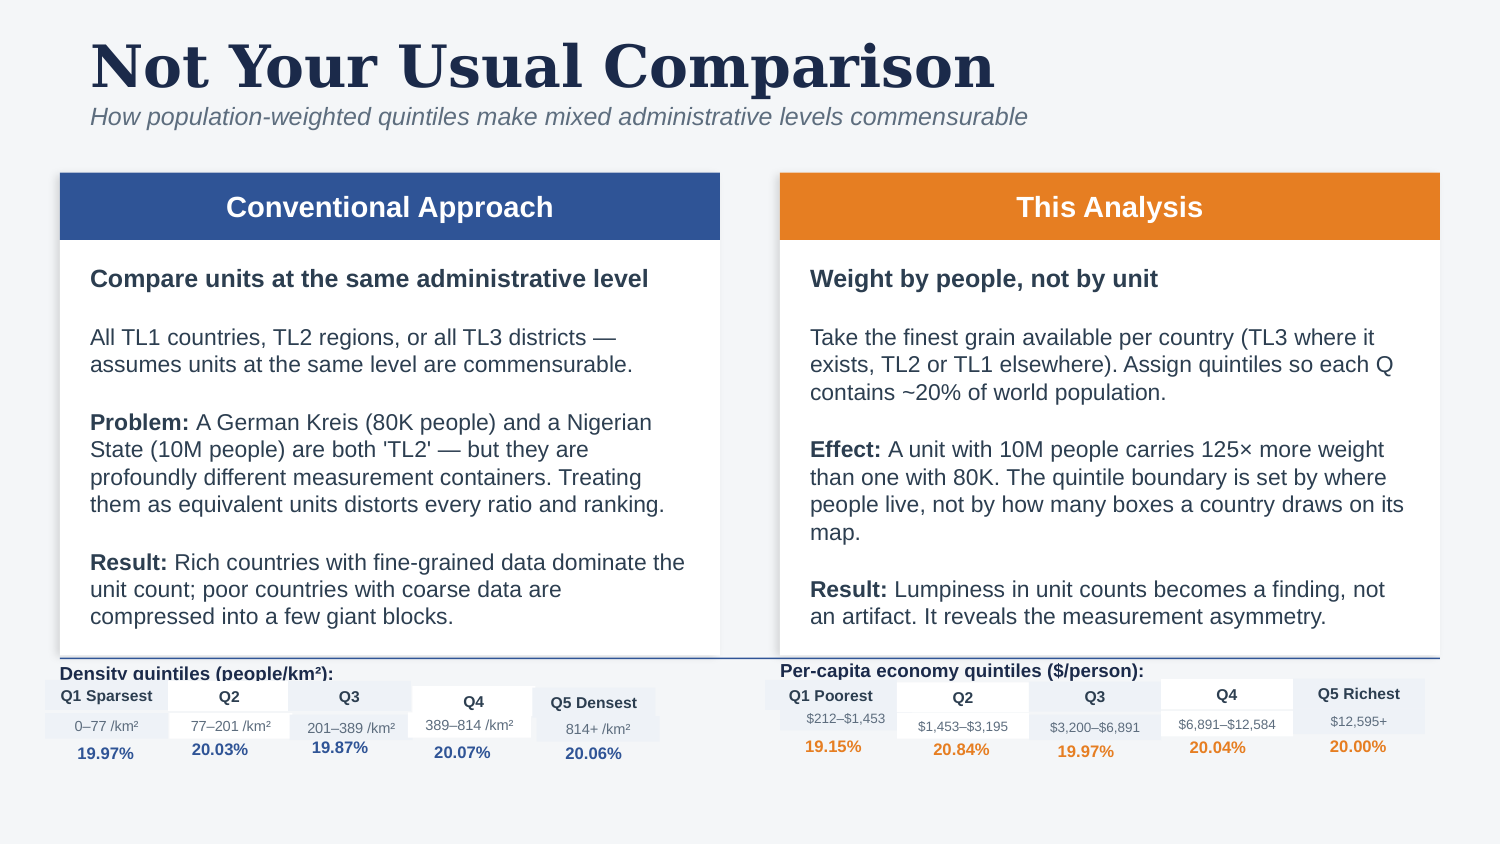
The method behind this: rather than comparing all administrative units at the same nominal level (a German Kreis of 80,000 people counted the same as a Nigerian state of 10 million), each of the 7,101 leaves is assigned to a population-weighted quintile — every quintile holds close to 20% of world population, not 20% of units. That’s what makes the lumpiness in unit counts a finding about the world’s data infrastructure rather than an artifact of the method.
The three charts
Related reading
- Five spatial scales — how TL1/TL2/TL3 administrative levels stack, and why “the finest grain available per country” is a moving target across 237 countries.
- How we grade what we publish — the badge system this crosstab’s Experimental rating comes from.
- Country balance sheets — what a single leaf in this grid looks like once you open it up.
Phase 2
The crosstab becomes an interactive D3 visualization — click a cell, drill into the countries inside it, click a country to land on its balance-sheet page. The data exists; the rendering is the only blocker.